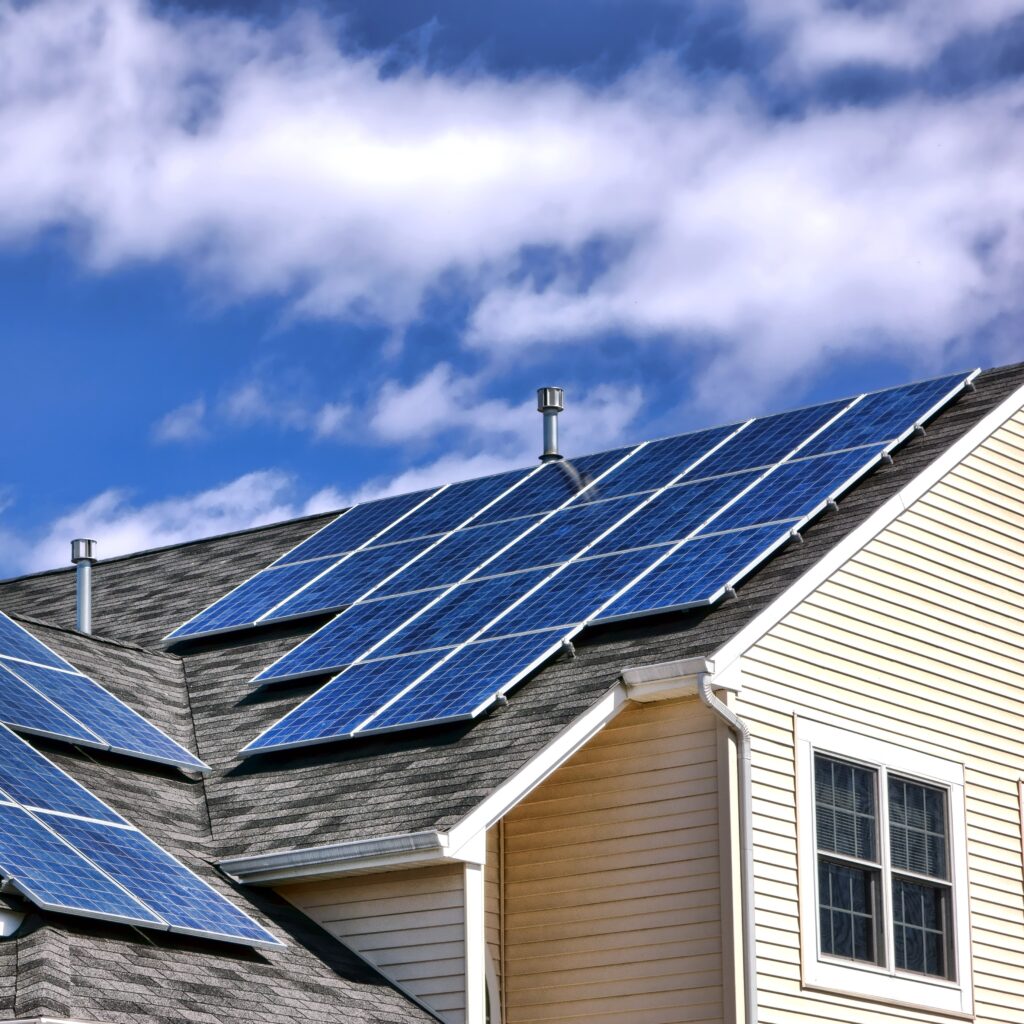
Solar panels capture energy from the sun. Solar energy is most prevalent in the southern states and varies with the seasons. Solar energy has no moving parts and it can be placed on rooftops or over parking areas eliminating the need for new land in many cases.
Residential systems can be added to your home roof. Commercial systems can be added to roofs, over parking areas, or available land. Larger scale utility systems can be setup to track the sun and are cheaper at scale but need new land in most cases.
What are the Costs?
Around $2,000 per KW for a utility scale system up to $4,000 per KW for a small scale, residential size system. Maintenance costs are around $16 per KW per year at the utility scale and $21 at the smaller scale. [1]
What is the Energy per Area? How does it vary by location and season?
About 1 MW per 8 acres at the utility scale [2]. Capacity factor (percent of energy captured) varies by location and season from single digits to over 40%. At a 23% Capacity factor, 1 megawatt will generate 0.23 x 8,760 hours per year = 2,015 MWH per year.
8 acres produces about 2,015 MWH per year. A square mile can produce 640/8 x 2,015 = 161,200 MWH per year.
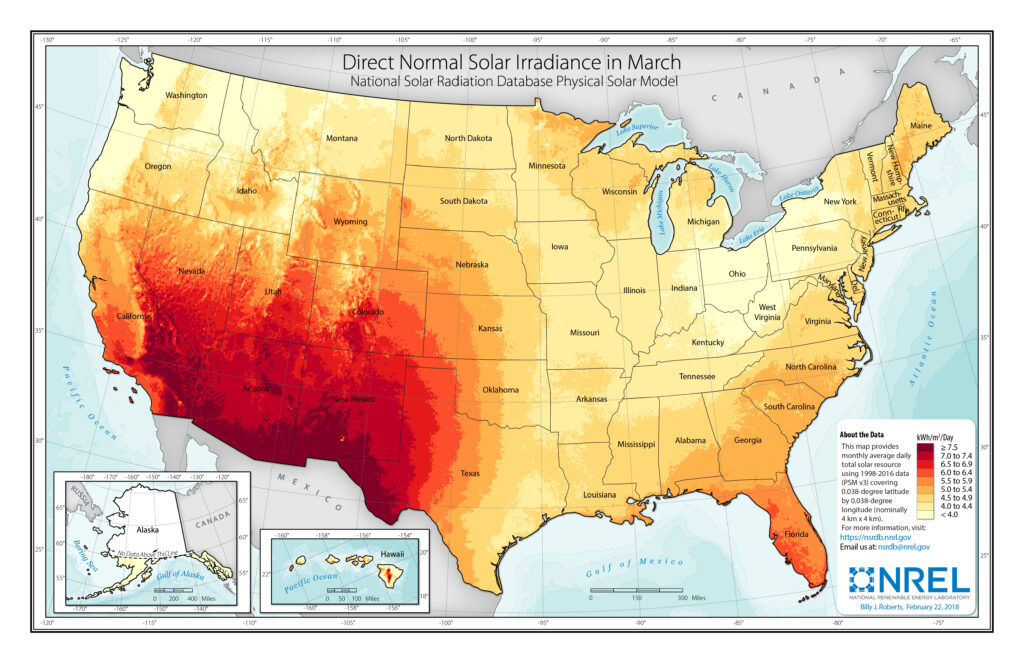
Solar irradiation maps for June (left), March (center), and January (right) [3] showing change with seasons and location. Visit https://www.nrel.gov/gis/solar.html for all 12 months of maps.
What is the degradation and lifespan?
About 0.5% per Year. Lifespan is greater than 30 years. [4]
WIND
Land Based Wind
Offshore Wind
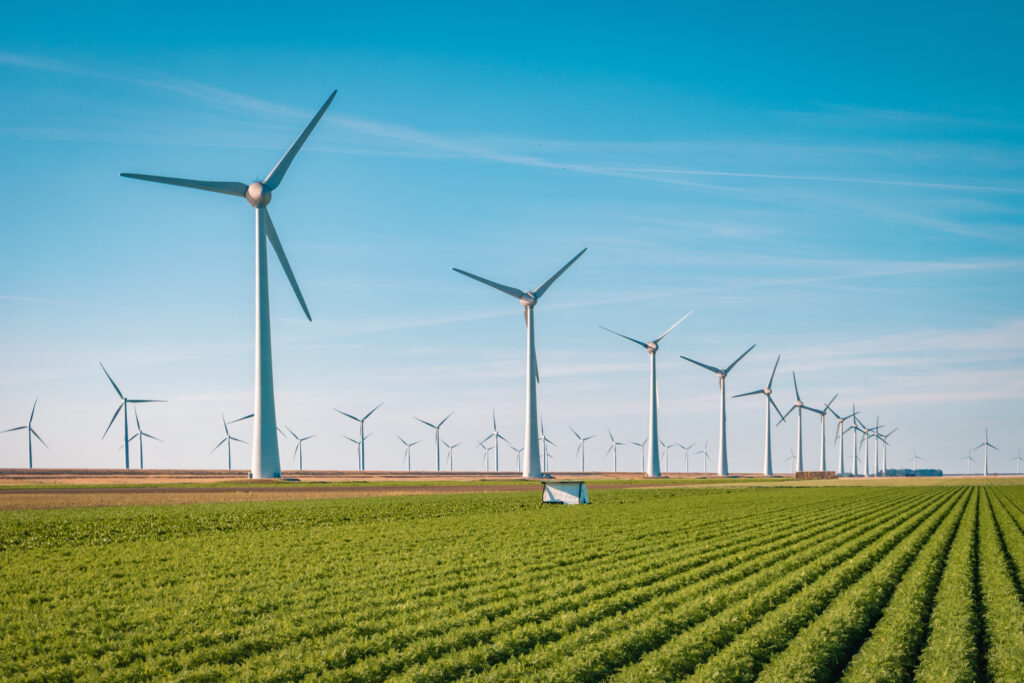
Wind turbines capture energy from wind as the air mass is pushed around the world by the sun. Uneven heating of the surface and topographic features create high and low pressure areas creating wind. Wind energy in the United States is greatest in the middle of the country, although it is doable in much of the United States. Offshore wind farms have recently been building up that have a greater cost, but take advantage of higher wind velocities over the ocean. Offshore wind farms can be built close to a metropolis without a need for land to build on.
What are the costs?
$2346 per KW, $33 per KW per year maintenance after that [1]
What is the Energy per Area? How does it vary by location and season?
Wind energy can be installed at approximately 12 MW per square kilometer. [5] It is variable, yet predictable. The largest wind energy is in the middle of the country or over the ocean. Wind energy in the colder Midwest and northeast actually shows to be a good complement to solar yielding about twice the capacity factor in winter than summer. [6]
Wind farms in high energy areas can have capacity factors over 45% while the lower end is around 25%. [7]
12 MW x 8760 hours per year x 0.3 capacity factor yields 31,500 MWH per year per square kilometer or 81,600 MWH per square mile.
Wind Energy Map from NREL [8][9][10][11]
Source: United States Energy Information Administration [6]
How much is degredation and what is the lifespan?
About 0.5% per year. Lifespan is greater than 20 years.
OTHERS
Other no or low carbon emitting energy technologies include geothermal, hydro, and nuclear. For simplicity, this website focuses on the apparent prevailing winners solar and wind.
Ong, S., Campbell, C., Denholm, P., Margolis, R., Hearth, G., (2013) “Land-Use Requirements for Solar Power Plants in the United States”. National Renewable Energy Laboratory. https://www.nrel.gov/docs/fy13osti/56290.pdf. Accessed March 9, 2021
Sengupta, M., Y. Xie, A. Lopez, A. Habte, G. Maclaurin, and J. Shelby. 2018. “The National Solar Radiation Data Base (NSRDB).” Renewable and Sustainable Energy Reviews 89 (June): 51-60.
Jordan, D., Kurtz, S., “Photovoltaic Degradation Rates — An Analytical Review.” (2012). Page 6. Journal Article Progress in Photovoltaics: Research and Applications. National Renewable Energy Laboratory.
Wind Exchange. The United States Department of Energy. “U.S. Wind Energy Performance (Capacity Factors) in 2017” https://windexchange.energy.gov/maps-data/332. Accessed March 10, 2021.
Draxl, C., B.M. Hodge, A. Clifton, and J. McCaa. 2015. Overview and Meteorological Validation of the Wind Integration National Dataset Toolkit (Technical Report, NREL/TP-5000-61740). Golden, CO: National Renewable Energy Laboratory.
Draxl, C., B.M. Hodge, A. Clifton, and J. McCaa. 2015. “The Wind Integration National Dataset (WIND) Toolkit.” Applied Energy 151: 355366.
Lieberman-Cribbin, W., C. Draxl, and A. Clifton. 2014. Guide to Using the WIND Toolkit Validation Code (Technical Report, NREL/TP-5000-62595). Golden, CO: National Renewable Energy Laboratory.
King, J., A. Clifton, and B.M. Hodge. 2014. Validation of Power Output for the WIND Toolkit (Technical Report, NREL/TP-5D00-61714). Golden, CO: National Renewable Energy Laboratory.